
Current air pollution levels contribute to 30,000 UK deaths each year, with an estimated cost to the UK economy and the NHS of £27 billion, according to The Royal College of Physicians (RCP). The death rates have declined from est. 40,000 in 2016 because air quality has improved, with traffic particulate emissions falling 6% between 2022 and 2023 alone. But there is still more to do.
Poor air quality is the greatest environmental risk to human health. Two road traffic emissions – PM2.5 and NO2 – are particularly harmful to the elderly, children, those with respiratory diseases such as asthma, and it can trigger cardiovascular conditions, and even dementia.
Concerned about the health impacts, in 2005, the World Health Organisation (WHO), set strict emission targets of 10 µg/m³ for PM2.5 and 40 µg/m³ for NO2, to be reached by 2030. The UK government incorporated these standards into its clean air policy, and they remain in place today. In 2021, the WHO reduced the limits to 5 µg/m³ of PM2.5 and 10 µg/m³ of NO2 by 2030.
Between 2005 and 2023, PM2.5 emissions fell by 46% and NO2 by 70% in England alone. The targets are clearly having an impact, but where in the UK is close to having clean air?
Our Research
New research by Believ analysed changes in air quality of local authorities and neighbourhoods (LSOAs) across the UK. We used annual mean measurements of population-weighted PM2.5, and annual mean NO2 levels from modelled pollution data published by the Department for Environment, Food & Rural Affairs (Defra) between two time periods, 2017–2019 and 2022–2024, carefully excluding COVID-affected years. We then compared the latest three-year annual average levels of those key pollutants to the UK’s 2030 targets and the WHO’s latest targets.
We also consulted two ‘clean air’ experts, Professor Stephen Holgate, Professor of Immunopharmacology from the University of Southampton, and Professor Frank Kelly, Battcock Chair of Community Health and Policy, Imperial College London, for exclusive insights into how air pollution impacts population health.
Key Findings
- 99% of local areas (LSOAs) in England and Wales have improved their air quality to meet the UK government’s 2030 target guidelines for average annual levels of PM2.5 and NO2, and all but one local authority in the United Kingdom meets UK target guidelines for PM2.5.
- Every local authority in Scotland and Northern Ireland has reduced air pollution below the WHO’s PM2.5 limit of 5 µg/m³ whereas no local authority across the East Midlands, East of England, London, South East and Yorkshire and the Humber has achieved that target so far.
- Portsmouth, Brighton & Hove, and Midway saw the greatest reductions in air pollution (PM2.5) of any UK local authority, bringing Portsmouth and Medway under the UK’s 2030 limits for the first time.
- 38% of WHO compliant authorities have improved their PM2.5 levels to become a fifth lower than the WHO’s target.
- Professor Stephen Holgate, Professor of Immunopharmacology from the University of Southampton explains: “700 diseases are linked to air pollution – reducing NO2 and PM2.5 particles by 1 µg/m³ improves survival and morbidity”.
The local authorities with the biggest fall in pollution
According to Believ’s analysis of Defra data, the top three local authorities in the UK to achieve the biggest reduction in PM2.5 pollution between 2019 and 2024 were Portsmouth (-4.3 µg/m³), Brighton & Hove (4.07 µg/m³) and Medway (3.86 µg/m³).
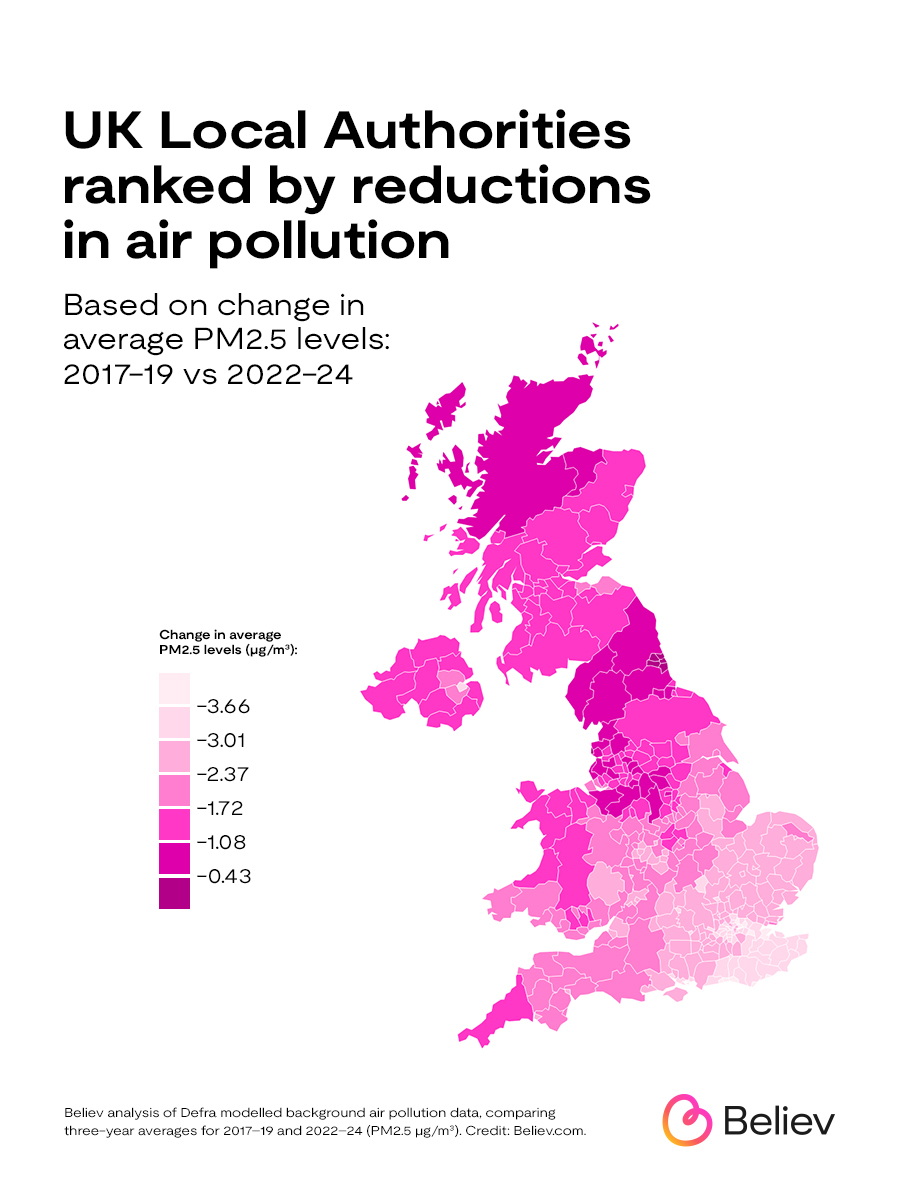
Portsmouth and Medway moved below the UK target of PM2.5 10 µg/m³ for the most recent time period (2022-2024). Brighton and Hove, however, had reached that level by 2019 and, now has fallen to 5.87 µg/m³ – close to the WHO’s more stringent 2021 target for PM2.5 of 5 µg/m³.
The result is remarkable considering the Government’s 2019 UK Clear Air Strategy, which reported the South East – home to these three local authorities – had the highest levels of pollution in the UK.
Also, Portsmouth is a busy port. According to the Air Pollutant Inventories For England, Scotland, Wales and Northern Ireland: 2005-2023, a third to half of Britain’s pollution comes from overseas, typically Europe, and is carried by the wind up the country. Some 77% of the UK’s PM2.5 emissions come from England, resulting in naturally lower levels across Scotland, Northern Ireland, the North of England and the South West.
Indeed, Defra’s data shows that the whole of the South West was already compliant with UK standards of 10 µg/m³ by 2019. The biggest gains in air quality across the region were in Exeter (-2.91), Cheltenham (-2.85) and Gloucester (-2.8).
By contrast, in London, no boroughs had achieved the target 10µg/m³ by 2019. But significant gains helped every local authority except the City of London reach it by 2022-2024, led by Barking and Dagenham (-3.79), Waltham Forest (-3.71), and Newham (-3.68).
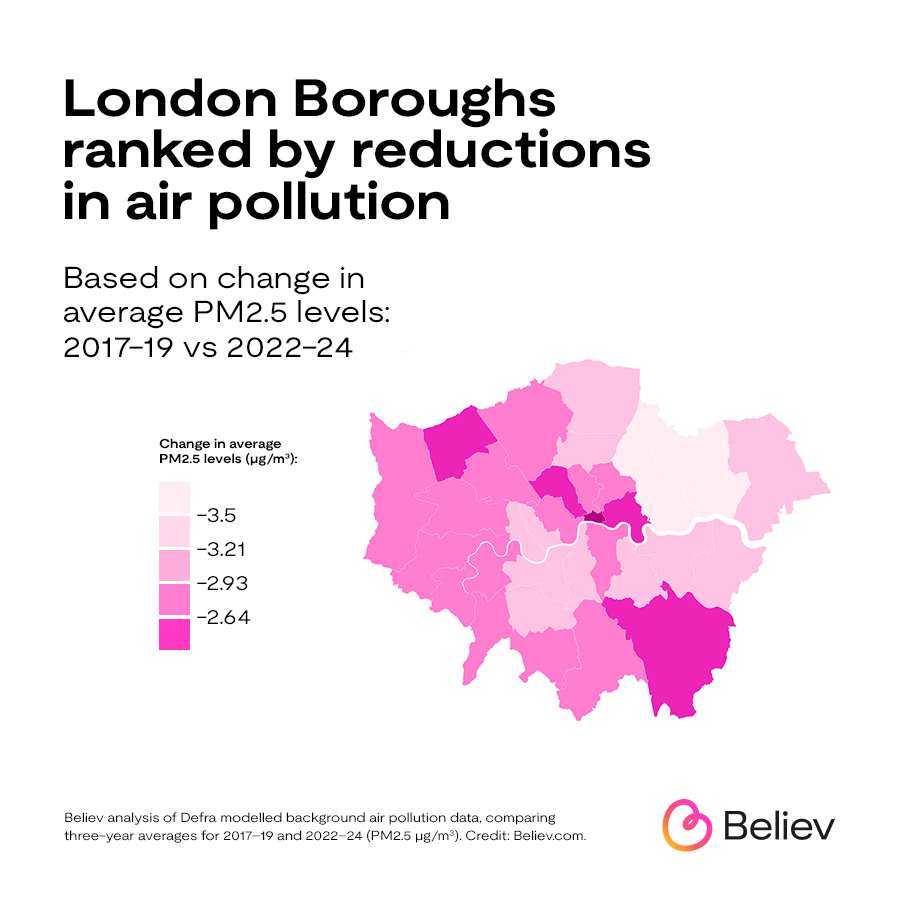
Above London, in the East, Luton (-3.31), Thurrock (3.06) and Ipswich (-2.98) had some of the biggest falls in PM2.5 levels, leading them and 13 others to catch up with the rest of the region in reaching the UK target.
Coventry (-2.67), Worcester (-2.57), and Sandwell (-2.5) led PM2.5 reductions in the West Midlands region; Sandwell’s improvement was significant. Previously, it was one of only two local authorities out of 30 above the UK standard in 2019.
In the East Midlands, all authorities except Leicester were UK compliant by 2019. Three of the top-performing local authorities were North Kesteven (-2.41), South Kesteven (-2.38), and Rutland ( -2.34). The gains in air quality here were noticeably smaller than in the East and the South East – a trend that continues the further North the local authority being discussed is situated.
Wales, Monmouthshire (-2.2), Newport (-2.09), and Pembrokeshire (-2.09) show the greatest reduction in pollution, with Pembrokeshire being among 11 of 22 authorities to achieve the WHO’s 5 µg/m³ by 2022-2024.
Similarly, the North West, led by Liverpool (-2.03), Halton (-1.97), and the Wirral (-1.76), and the North East, led by Redcar and Cleveland (-1.57), Hartlepool (-1.19), and Middlesbrough (-1.12), had falling pollution levels.
Professor Stephen Holgate found the UK is clearly making progress:
“Most local authorities have reached the UK’s targets, but that isn’t ‘job done’. The RCP report finds there is no safe level of air pollution; even reducing NO2 and PM2.5 particles by 1 µg/m³ improves survival and morbidity from chronic non-communicable diseases. Many local authorities are now adopting the attitude of ‘keep pushing down’.”
Those regions, already well below the UK target in 2019, are now rapidly approaching the WHO’s PM2.5 limit of 5 µg/m³. Liverpool, for instance, has just 6.6 µg/m³ of PM2.5.
With Portsmouth, Coventry, and Liverpool leading their regions, it shows that achieving clean air is possible even in highly populated, traffic-heavy metropolitan areas. Liverpool is also a port which, like Portsmouth, has high levels of pollution from port roads and marine traffic.
Less traffic pollution saves lives
Clearly, progress is being made in reducing levels of pollution across the country. Improving air quality is essential because, as the Royal College of Physicians (RCP) reported in 2025, road traffic pollution is linked strongly with lung and heart disease and dementia and still contributes to 30,000 deaths in the UK each year.
Professor Steven Holgate explains the impacts of traffic-driven air pollution on our health:
“It accelerates ageing in all organs within the human body, and 700 diseases, from osteoporosis to dementia are linked to pollution. Places like London, Bradford, Glasgow, Manchester and Bath that have introduced low emission zones are all showing benefits, greater reductions in PM2.5 and NO2 than anticipated. But we may be getting health benefits at much lower reductions than people realise. In the east end of London, lung growth in children improved while in Bradford, GP visits fell 30% and A&E admissions 50% for cardiovascular and respiratory crisis. This is no longer just an environmental issue. It is a public health issue. It is going to be important to educate local authorities and the wider public that this is a problem that impacts the entire life course, so there is even more incentive to make further improvements.”
Two road traffic pollutants mainly impact clean air and people’s health. NO2 gas, inhaled, irritates the lungs and is harmful to people with existing heart and lung conditions. PM2.5 breathed into the lungs, enters the bloodstream, and lodges in organs and tissues. Over time, exposure is linked to health problems such as strokes, heart disease, cancer, and dementia. Children, the elderly, pregnant women, and those living in less affluent areas which are often highly polluted are often more affected.
Nevertheless, the RCP also finds that deaths from NO2 and PM2.5 emissions fell from 40,000 in 2016 to 36,000 in 2019, and are down to 30,000 today, so progress is being made.
Matt Croucher, Chief Commercial Officer at Believ, explains the importance of sustainable transport as the UK strives towards clean air for all:
“Sustainable transport is a key part of delivering cleaner air for all. Transport planning must always include facilities to help people walk, cycle and use public transport, but we must also recognise that car usage still makes up 60% of all UK trips, and 78% of distance travelled.
The electrification of transport is therefore an important element in reducing airborne pollutants caused by vehicle emissions.”
Where is Britain’s air clean enough to meet the UK’s and WHO’s standards?
Across the UK, 20% (71) of local authorities have reached the lower PM2.5 target of 5 µg/m³ and 27 (38%) of them have PM2.5 levels of 4 µg/m³ or less – one fifth below the suggested standard.
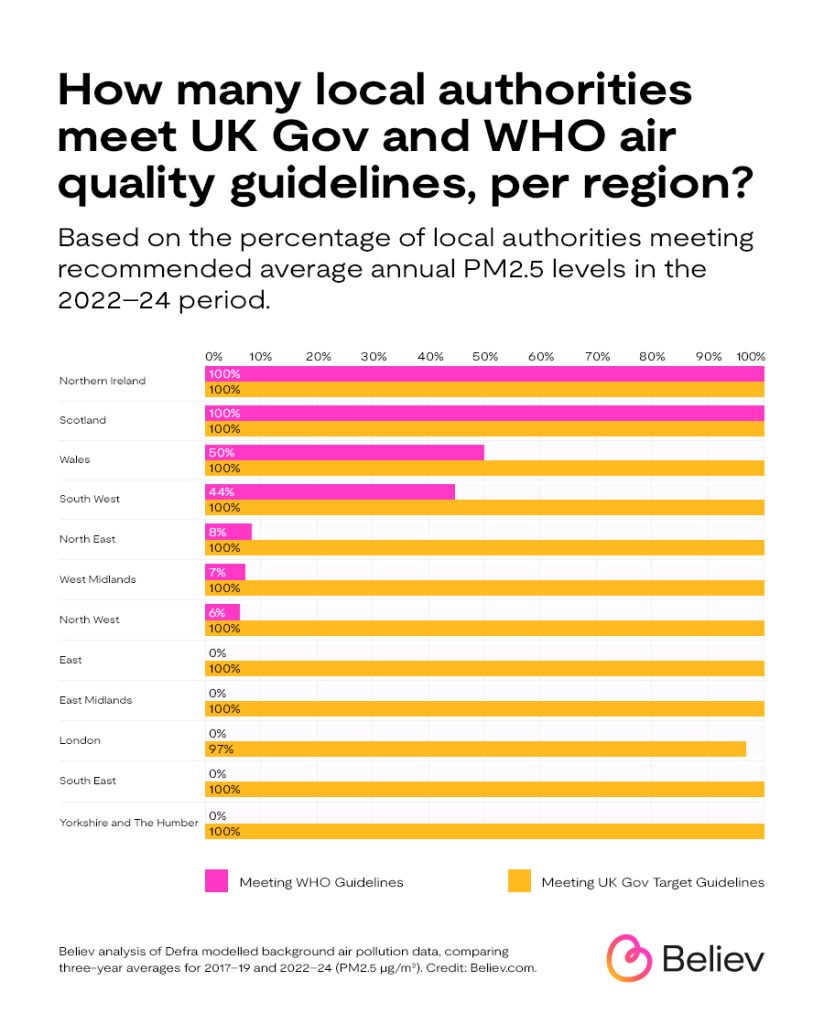
All the Scottish (100%), Northern Irish (100%), half the Welsh (50%), and 12 of 26 (44%) local authorities in the South West now have PM2.5 levels below 5 µg/m³. Two local authorities from the North West, Cumberland and Westmorland and Furness (6%), two from the Midlands, Herefordshire County and Shropshire (7%) and one from the North East, Northumberland (8%) also join them.
The list includes densely populated cities, led by Derry City and Strabane (3.99 µg/m³) and Belfast (4.81 µg/m³) in Ireland, Stirling (3.73 µg/m³), Dundee (3.83 µg/m³), Aberdeen City (4.06 µg/m³), Edinburgh (4.45 µg/m³), Glasgow (4.61 µg/m³), in Scotland and Exeter (4.47 µg/m³) and Plymouth (4.51 µg/m³) in the South West.
Encouragingly, these cities and towns are achieving significant gains in air quality. Although they are not as polluted as other major cities, such as London, they show how cleaner air can be achieved in areas with high traffic volumes.
Other parts of the country, including the East, the East Midlands, the South East, and Yorkshire and Humberside, are making somewhat slower progress towards those targets.
Cleaning up our local neighbourhoods
Looking more closely at the local areas – defined here as LSOAs – two-thirds had already achieved the UK PM2.5 target of 10 µg/m³ by 2019, and the remaining 34% reached it by 2022-2024. So, 100% of local areas in England and Wales now meet the UK targets. But how many of our local neighbourhoods are on track to meet the WHO’s revised 2021 targets?
Frank Kelly, Battcock Chair of Community Health and Policy, Imperial College London explains:
“Many UK local authorities and LSOAs meet the UK government’s target for air quality, but the WHO health bar is significantly higher. Policy can be at the national level (ie Governmental) or at the city Level (ie Mayoral). Even though London has achieved fantastic improvements in air quality, at the current pace, it will not meet WHO guidelines for NO2 by 2030. More policy-driven reductions are needed. Those reductions include more cleaner buses and taxis, stronger rules on construction site emissions, reduced traffic overall, and safer, more appealing walking and cycling routes.”
Naturally, there will be some regions, such as London, the East and the East Midlands, which are not yet compliant with the new standards, because the level of change required needs time to take effect.
The research finds most LSOAs across the county today remain above the WHO’s 2021 standards. But there is progress.
- In the North East, some 42% of Northumberland’s LSOAs have reduced levels to meet the stricter targets of PM2.5 5 µg/m³ and NO2 10 µg/m³.
- In the North West, 76% of Cumberland’s, 61% of Westmoreland and Furness’s and 13% of Lancaster’s LSOAs are below the WHO targets.
- In North Yorkshire, 18% have also fallen below the WHO thresholds.
- The proportion of compliant LSOAs in the West Midlands is lower: 25% in Herefordshire County, 19% in Shropshire, 18% in Shropshire, and 2% in the Malvern Hills.
- The South West is faring better; Plymouth and the Cotswolds have moved 85% and 41% of LSOAs, respectively, below WHO’s PM2.5 µg/m³ target.
Even better progress is being made in the South East where a greater number of local authorities are moving a higher proportion of LSOAs below WHO’s 2021 targets. Reading (98%), Slough (97%), Bracknell Forest (97%), Gravesham (90%) and Basingstoke (89%) have been the most successful not only in their region but across the whole country. Waverley (79%) Arun (25%), Tonbridge and Malling (36%) and the Isle of Wight (36%) are also progressing well.
This shift in LSOA compliance in the South West, alongside Portsmouth and Medway being ranked among the top three in the country for falling PM2.5 levels, is a considerable achievement.
Achieving cleaner air
Southampton University’s Clean Air South report says local governments have few powers to improve air quality, but also discusses how across the south, regions such as Hampshire and Dorset improved partly through effectively controlling road emissions, new local traffic management policies, such as Portsmouth’s clean air zone and park and ride initiatives, and cleaner vehicles on the road, such as electric vehicles (EVs).
According to the Air Pollution Inventories (API), since 2005, overall PM2.5 emissions have fallen by 46% in England, and emissions from passenger vehicles have reduced by 81%. The API attributes the overall decline to a reduced coal-fired electricity generation and fewer transport-sector emissions because stringent emissions standards were introduced, and the uptake of EVs increased in recent years.
Some 21% of total PM2.5 emissions come from road traffic. Particles are released into the air as brake pads, brake discs and tyres wear down. Defra says levels are increasingly due to more traffic, plus older and heavier vehicles on the road.
Whilst some suggest that EVs are heavier than conventional cars and therefore contribute to rising PM2.5 levels, the RAC argues that regenerative braking, which relies on the electric motor rather brake pads and discs, offsets the impact. EIT Urban Mobility (the EU policy and technology eco-system) in its 2025 study on non-exhaust emissions in road transport found regenerative braking reduces emissions by 80% and it reports new European emission limits for brake and tyre wear from 2026 will encourage manufacturers to use wear-resistant materials.
NO2 emissions have also fallen since 2005. Today 19% comes from fossil-fueled energy generation, and 30% from road transport, but levels had fallen 77% and 70% respectively by 2023.
DEFRA says catalytic converters, emissions controls, older vehicles being replaced by newer, less polluting vehicles, and the rise in EVs with no exhaust pollution have significantly reduced road emissions of exhaust PM2.5 and NOx (NO and NO2).
Professor Stephen Holgate says pollution and our response is naturally evolving:
“Air pollution will change as vehicle exhaust emissions drop with technology improvements and the increase in EVs. And manufacturers will respond with new materials for tyres and brakes, for instance.”
EVs contribute to the fall in both NO2, and PM2.5 both directly and indirectly. Aside from no tailpipe emissions, EV drivers want to charge their cars with electricity from renewable non-polluting sources so many CPOs (Charge Point Operators) like Believ only supply 100% clean energy.
Overall, the signs are positive and tremendous progress is being made to reduce road traffic pollution across the UK. It. Imperative to the health of the nation that we continue to reduce levels of PM2.5 and NO2.
Air pollution will change as vehicle exhaust emissions drop with technology improvements and EV uptake increases. Manufacturers will respond with new materials for tyres and brakes, for instance.
Local authorities have made great strides towards giving us cleaner air – even in our towns and cities, which are the most populated and some of the most polluted parts of the country. The EV industry is supporting the road to cleaner air: tailpipes emit zero emissions, regenerative braking reduces PM2.5 emissions, and CPOs are installing a network of clean energy for drivers.
There is more to do to reduce the 1 in 19 deaths each year attributable to PM2.5 and NO2 pollution. But, where we see significant falls in pollution in places like Portsmouth and Liverpool, and their achievement of the strict WHO standards, there is no reason why we cannot ensure everyone can breathe easier, no matter where they live.
Policy matters
Richard Turnbull, Head of Public Affairs & Commercial Partnerships at Believ, explains that maintaining the integrity of the UK ZEV mandate is critical to meeting legally binding air quality targets.
“Achieving the Environment Act’s requirement for a 30% reduction of PM2.5 by 2030 depends on rapid fleet turnover in the 2020s rather than delaying action until the 2030s.
“International evidence shows that added flexibilities weaken real world outcomes. It’s anticipated that recent EU moves to soften vehicle CO2 standards will disrupt EV uptake and increase cumulative tailpipe emissions, delaying air quality and health benefits. Flexibility alters market behaviour and investment signals, slowing electrification when early progress matters most. The ZEV mandate is a minimum requirement for how we will achieve net zero goals on time, and further flexibilities would shift costs and risks onto communities while delaying progress toward health-based standards.
“Strong, stable mandates reduce the need for more intrusive local measures. For the UK certainty in the ZEV framework supports critical charging infrastructure investment, accelerates EV availability and fleet adoption, and helps avoid greater reliance on Clean Air Zones and congestion charging schemes that disproportionately affect households and small businesses, and also avoids delaying progress towards health-based standards.”
Pollution, Policy and Public Health: A Q&A with Professor Frank Kelly
Battcock Chair of Community Health and Policy, Imperial College London
- There’s a considerable gap between how many UK local authorities and LSOAs meet WHO standards vs the UK government’s target for air quality. What reasons are there to be optimistic that the UK will continue reducing air pollution to meet WHO limits, and what key barriers exist to achieving that?
True, many UK local authorities and LSOAs meet the UK government’s target for air quality, but the WHO health bar is significantly higher. Policy can be at the national level (i.e. Governmental) or at the city Level (i.e. Mayoral). Even though London has achieved fantastic improvements in air quality, at the current pace, it will not meet WHO guidelines for NO2 by 2030. More policy-driven reductions are needed. Those reductions include more cleaner buses and taxis, stronger rules on construction site emissions, reduced traffic overall, and safer, more appealing walking and cycling routes. Progress is possible—but it will be incremental, as vehicle fleets turnover and infrastructure evolves. The situation in other major cities is not so hopeful because of fewer local policies and a lack of national policy.
- What have we learned from urban air-quality interventions, such as low-emission zones, about their effectiveness in reducing air pollution and improving health outcomes?
If traffic emissions have been identified to be the major source of pollution in an urban area then controlling traffic volumes (Congestion Charging) and discouraging older vehicle entry (LEZ/ULEZ) are very effective measures. Although these schemes are quickly effective in improving air quality, it takes longer periods of time to see health statistics improve due to the (often) chronic aspect of exposure and disease occurrence. The exception to this would be asthma exacerbation stats which can be improved quite quickly (If nothing else has a major negative influence).
- How meaningful is LSOA-level air-quality data vs more granular (i.e. street level) data for designing effective local policy?
LSOA data can be used to examine neighbourhood air quality changes in response to wider policies while street level data is useful in examining local policies such as School Street closures. Street level data is also useful for planning low pollution journeys i.e. apps such as London Air.
- What role do transport and planning factors, such as road layout, traffic flow and proximity to densely populated areas, play in impacting our health from the air we breathe?
Congestion increases transport emissions, and if this is in an urban location, it will increase population exposure. Road layout and traffic flow are therefore key factors – but history has shown that even the best urban road planning eventually fails due to traffic growth. Hence, the only real answer here is car use reduction via the provision of clean, reliable and affordable public transport networks.
Methodology
Believ analysed Defra’s modelled pollution data to examine changes in air pollution across the UK between two three-year periods: 2017–2019 and 2022–2024. These two time periods were chosen to exclude years affected by COVID. Pollution levels across the UK have reduced by 6%
Average (mean) pollutant concentrations were measured in micrograms per cubic metre (µg/m³).
At the local authority level, numerical changes in population-weighted average annual PM2.5 levels (anthropogenic) used Defra estimates in µg/m³.
At the neighbourhood level (LSOAs in England and Wales area-weighted, annual mean PM2.5 and NO₂ from Defra’s 1 km modelled grids, used µg/m³.
We assessed whether local authorities and neighbourhoods moved into or out of exceedance of air-quality guidelines set by the World Health Organisation (WHO) and the UK Government. Results were interpreted against both WHO health-based thresholds and current UK legal limits to distinguish overall improvement from progress toward safer, cleaner air targets.
We analysed changes in air quality at the local authority and neighbourhood levels using modelled background data from Defra.
LSOA 2021 → Local Authority District lookup, from the ONS Open Geography Portal.
Annual mean PM2.5 and NO₂, published as gridded datasets covering the UK.
LSOA 2021 boundaries (England & Wales) via Geoportal, from ONS / data.gov.uk